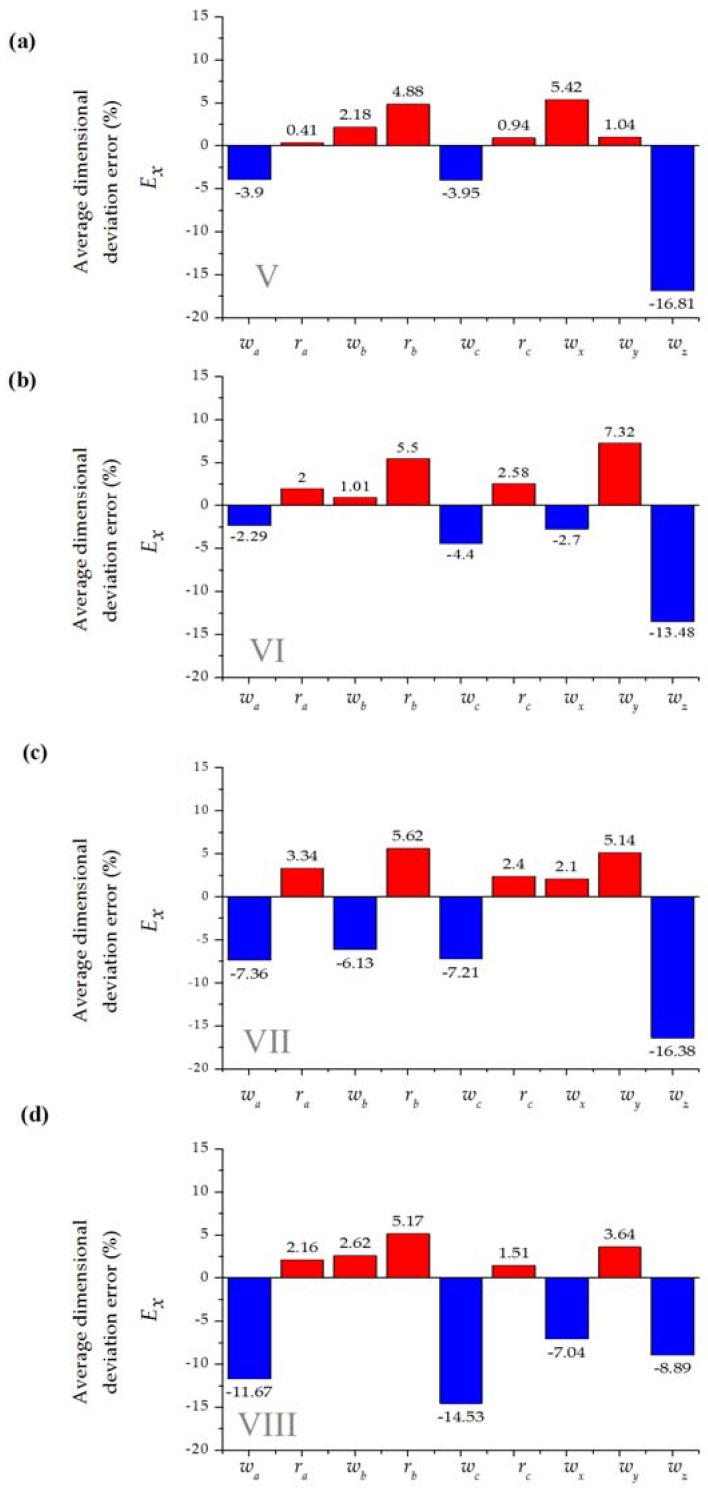
Figure 5.
Average dimensional deviation error (%) for wnom = 200 μm microchannel T-micromixer design with three replicates (see Table 3 for details, red represents overcutting and blue undercutting); (a) Setup V; (b) Setup VI; (c) Setup VII; (d) Setup VIII.

