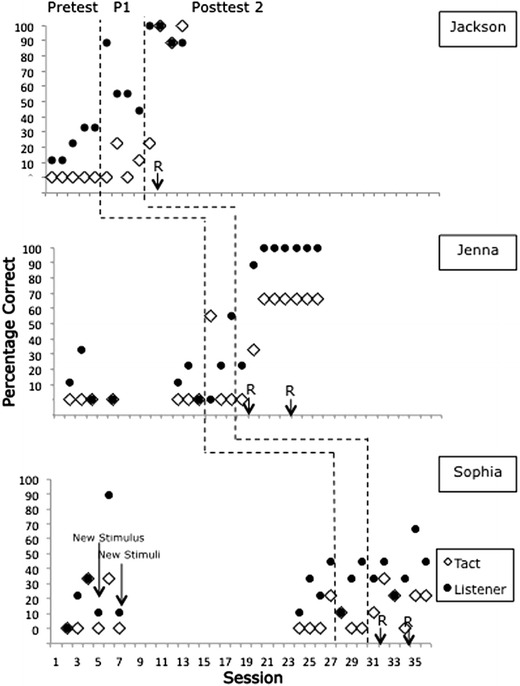
Fig. 1.

The percentage of correct tact and listener responses with the original set of stimuli for Jackson, Jenna, and Sophia. Remedial instruction is depicted by the “R” along the x-axis. Posttest 1 with the original set of stimuli is depicted by the “P1” condition label
