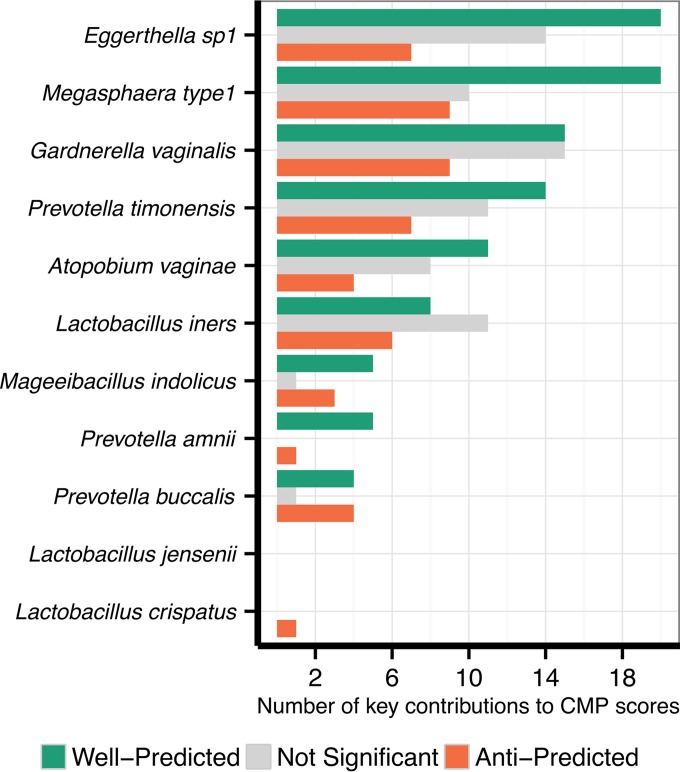
FIG 3 .
Key species contributors to metabolites in the vaginal microbiome. Each species that participated in the calculation of CMP scores in data set 1 is shown along the y axis. The x axis indicates the numbers of well-predicted and anti-predicted metabolites (as well as those with nonsignificant predictions) for which that species was a key contributor (see Materials and Methods).

