
Extended Data Figure 3. Assessing the extent to which population stratification affects the estimates from the GWAS.
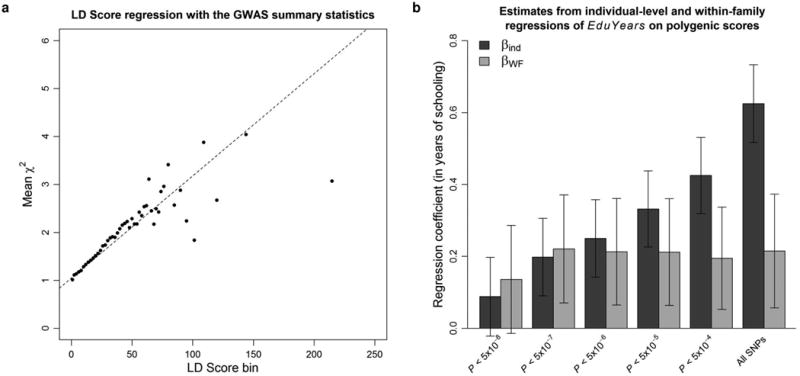
a, LD Score regression plot with the summary statistics from the GWAS. Each point represents an LD Score quantile for a chromosome (the x and y coordinates of the point are the mean LD Score and the mean χ2 statistic of variants in that quantile). The facts that the intercept is close to one and that the χ2 statistics increase linearly with the LD Scores suggest that the bulk of the inflation in the χ2 statistics is due to true polygenic signal and not to population stratification. b, Estimates and 95% confidence intervals from individual-level and WF regressions of EduYears on polygenic scores, for scores constructed with sets of SNPs meeting different P-value thresholds. In addition to the analyses shown here, we conduct a sign concordance test, and we decompose the variance of the polygenic score. Overall, these analyses suggest that population stratification is unlikely to be a major concern for our 74 lead SNPs. See Supplementary Information section 3 for additional details.