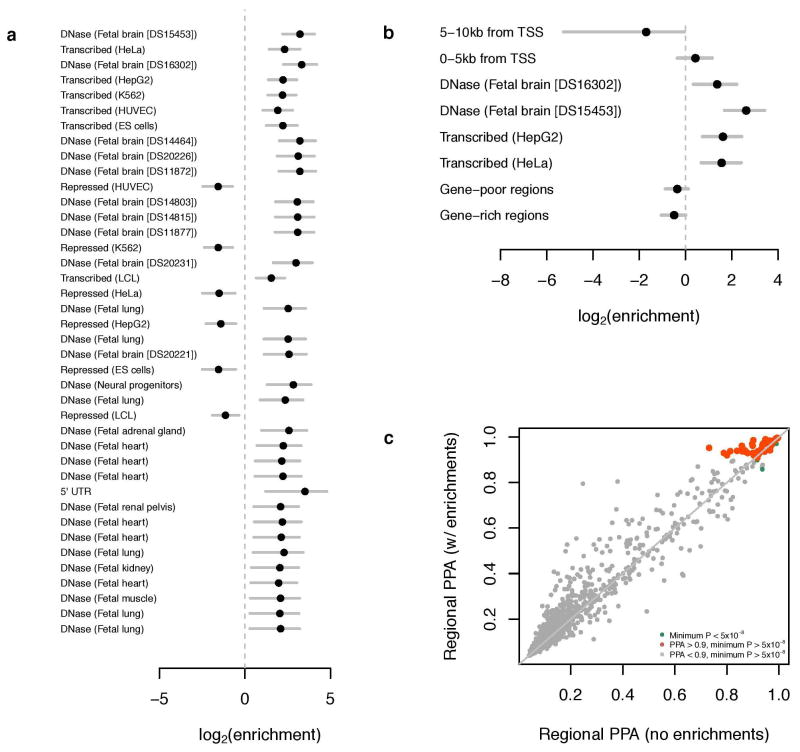
Extended Data Figure 7. Application of fgwas to EduYears. See Supplementary Information section 4.2 for further details.
a, The results of single-annotation models. “Enrichment” refers to the factor by which the prior odds of association at an LD-defined region must be multiplied if the region bears the given annotation; this factor is estimated using an empirical Bayes method applied to all SNPs in the GWAS meta-analysis regardless of statistical significance. Annotations were derived from ENCODE and a number of other data sources. Plotted are the base-2 logarithms of the enrichments and their 95% confidence intervals. Multiple instances of the same annotation correspond to independent replicates of the same experiment. b, The results of combining multiple annotations and applying model selection and cross-validation. Although the maximum-likelihood estimates are plotted, model selection was performed with penalized likelihood. c, Reweighting of GWAS loci. Each point represents an LD-defined region of the genome, and shown are the regional posterior probabilities of association (PPAs). The x-axis give the PPA calculated from the GWAS summary statistics alone, whereas the y-axis gives the PPA upon reweighting on the basis of the annotations in b. The orange points represent genomic regions where the PPA is equivalent to the standard GWAS significance threshold only upon reweighting.

