
Fig. 2.
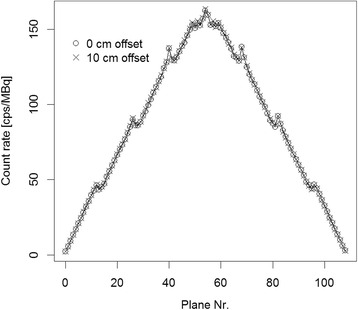
mCT Flow. Axial sensitivity profile for the measurements with the line source in the center of the field of view and at 10-cm radial offset
Official websites use .gov
A
.gov website belongs to an official
government organization in the United States.
Secure .gov websites use HTTPS
A lock (
) or https:// means you've safely
connected to the .gov website. Share sensitive
information only on official, secure websites.
mCT Flow. Axial sensitivity profile for the measurements with the line source in the center of the field of view and at 10-cm radial offset