
Fig. 3.
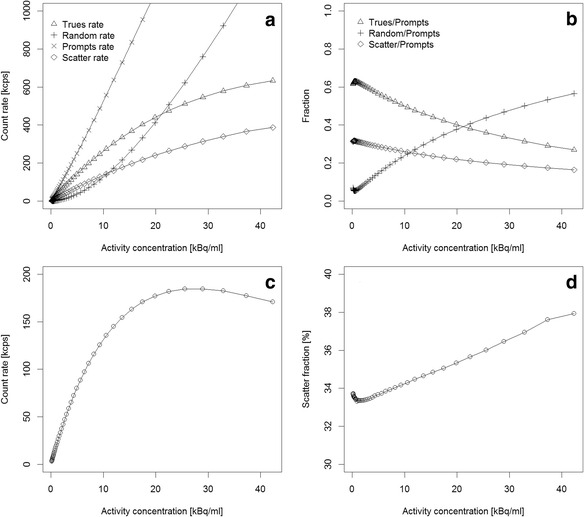
mCT Flow. a Prompts, trues, randoms, and scatter count rates. b Fraction of trues, randoms, and scatter counts vs the total number of coincidences processed. c NECR curve for the measured range of activities. d Scatter fraction (in %) for the same range of activities