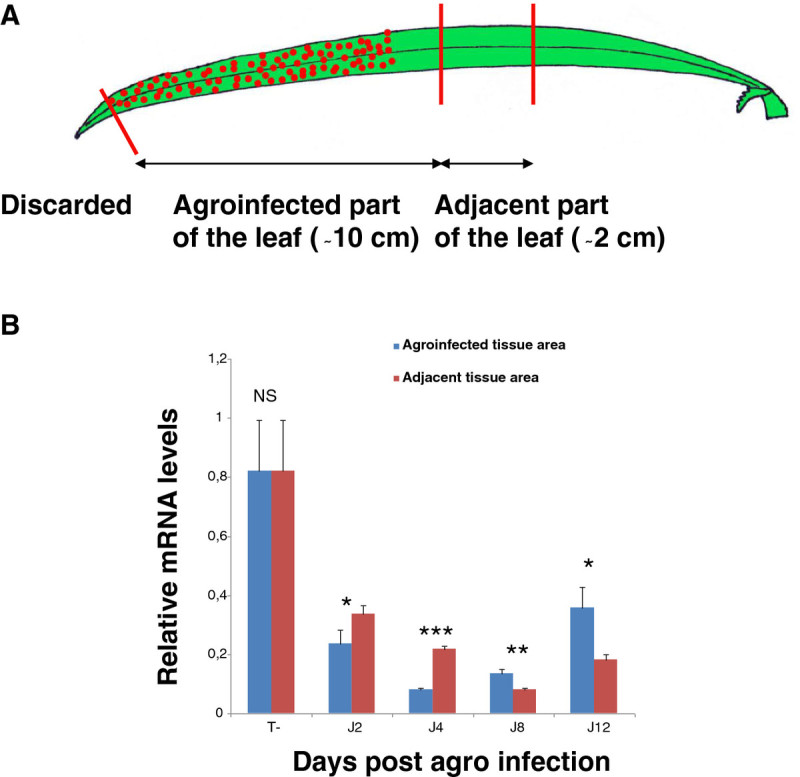
Figure 6.

Analysis of the movement of the OsPDS silencing signal from agroinfiltrated leaf tissues. (A) Schematic representation of the rice leaf. Wounded and agroinfected part of the leaf and adjacent part are indicated. (B) Real-time PCR time course analysis of OsPDS transcript accumulation in the agro-infiltrated and adjacent region of the leaf. Results of 3 biological replicates are shown. Primer sequences were: 5’-pds, 5’-GTTCCTGATCGAGTGAACGATG-3’, 3’-pds, 5’-CGAACATGGTCAACAATAGGC-3’; 5’-OsExp, 5’-CGGTTAGCTAGAGTTCATGTGAGA-3’, and 3’-OsExp, 5’-ATTGGAGTAGTGGAGTGCCAAA-3’. NS, *, **,and *** means non significantly different and statistically different at the 5%, 1% and 0.1% level in a t-student test respectively.
