
Figure 1.
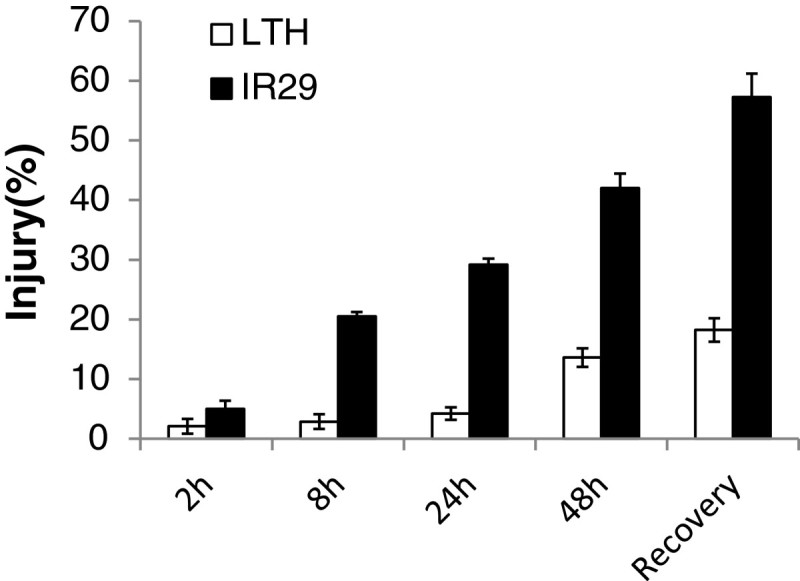
Mean genotypic differences in cell membrane injury between LTH and IR29 under the 4°C chilling stress and non-stress control for 2, 8, 24, and 48 h and subsequent recovery for 24 h. Vertical bars indicate the standard errors.
Official websites use .gov
A
.gov website belongs to an official
government organization in the United States.
Secure .gov websites use HTTPS
A lock (
) or https:// means you've safely
connected to the .gov website. Share sensitive
information only on official, secure websites.
Mean genotypic differences in cell membrane injury between LTH and IR29 under the 4°C chilling stress and non-stress control for 2, 8, 24, and 48 h and subsequent recovery for 24 h. Vertical bars indicate the standard errors.