
Figure 2.
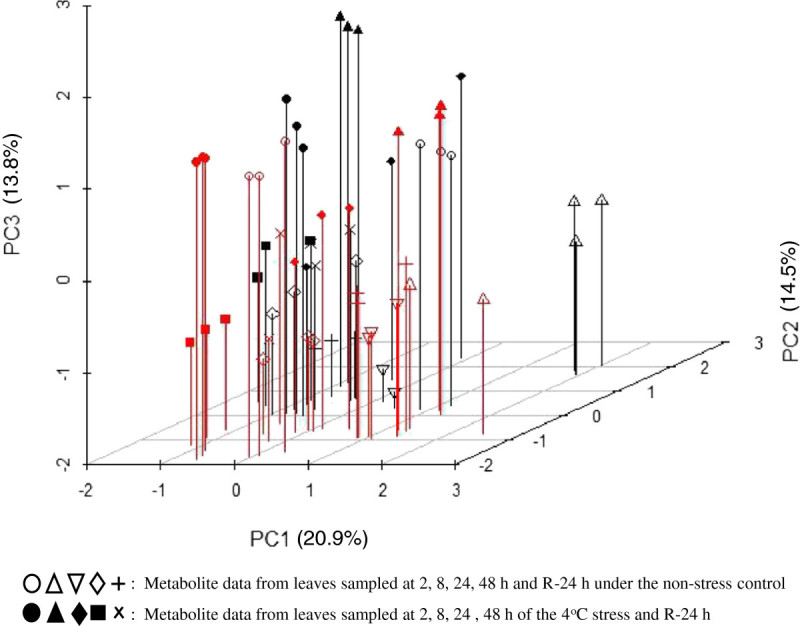
The plot of the first three principal components of the leaf metabolites in two rice genotypes, LTH and IR29, sampled in three biological replicates at the time points of 2, 8, 24, and 48 h after the 4°C chilling stress and 24 h after recovery (R). The red color and black one indicated IR29 and LTH.