
Figure 3.
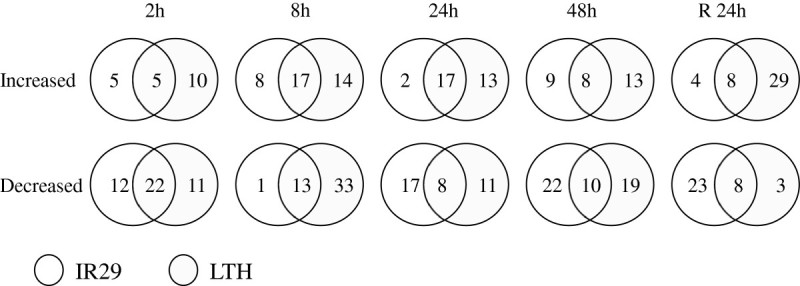
Venn diagrams showing coordinated significant (p ≤ 0.05) increases and decreases between two rice genotypes, LTH and IR29, for a set of 106 identified metabolites measured at the time points of 2, 8, 24, and 48 h of the 4°C chilling stress and 24 h after recovery.