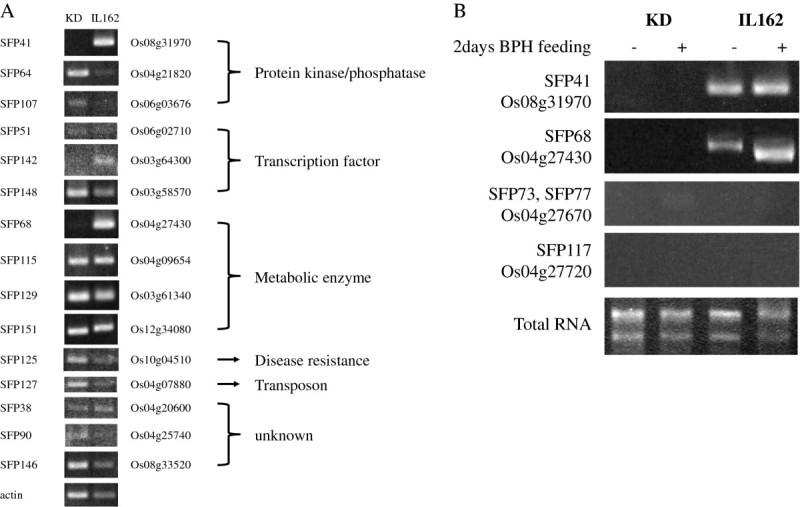
Figure 2.

Expression analysis of SFP-containing genes by RT-PCR. (A) RT-PCR analysis of rice lines KD and IL162. SFP and LOC numbers are from (Additional file 2: Table S1). Actin was used as a positive control. The functional classes of these genes refer to the functional classes in (Additional file 3: Table S2). (B) Expression analysis of rice plants following two days of BPH infestation (+) and control plants (−). The total RNA in each lane is represented by the amount of RNA used in the reaction.
