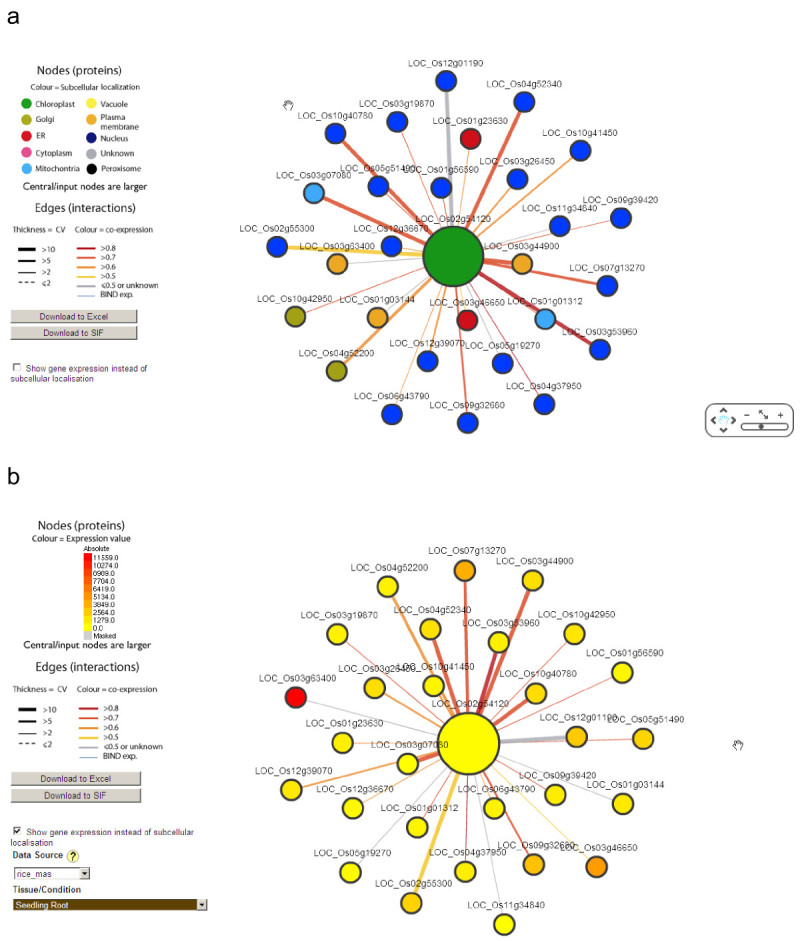
Figure 6.

Visualizing the rice interactome by RIV. a, nodes are colored according to its subcellular localization, edges are colored according to its coexpression correlation and the line thickness correlates to CV. The popup message is the ID, annotation and subcellular localization of the clicked node. b, same as a except the nodes color represent the expression level in “Seeding Root” tissue.
