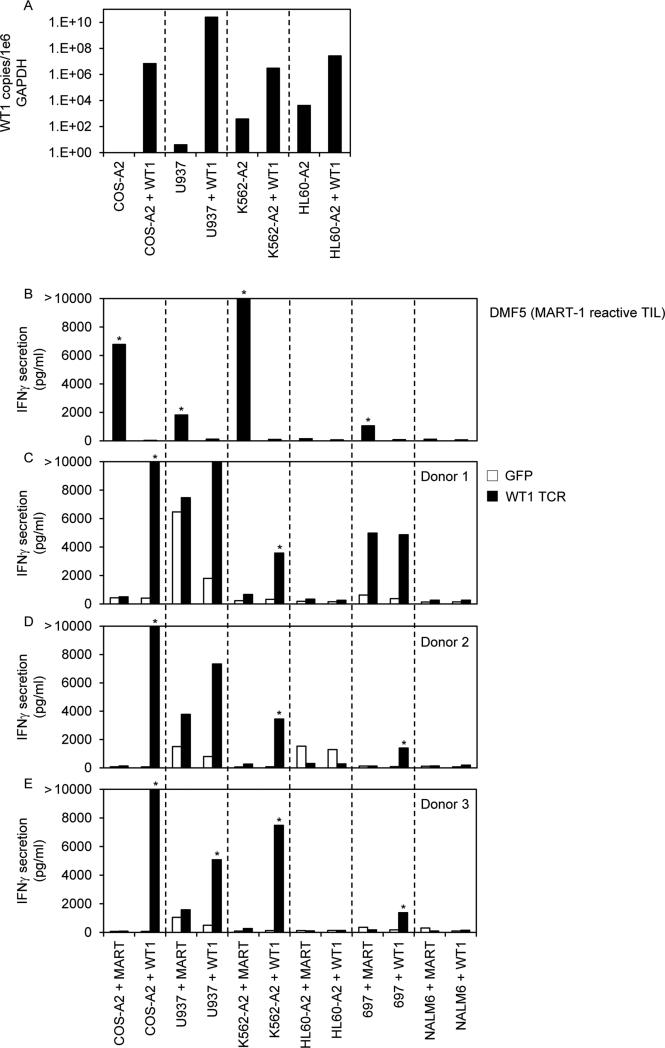
Figure 5.
WT1 RNA expression in tumor cell lines electroporated with WT1 cDNA and recognition by PBL retrovirally transduced to express a WT1 reactive TCR. (A) Quantitative RT-PCRs for WT1 and GAPDH were conducted on RNAs isolated from tumor cell lines electroporated with WT1 cDNA or mock-electroporated. WT1 RNA copies were divided by GAPDH copies and expressed as WT1 copy number per 1e6 GAPDH copy number. (B-E) PBL from 3 HLA-A*0201+ donors were transduced with retroviral particles encoding GFP as a negative control or with the WT1 reactive TCR (TRAV12-1*01; CDR3: CVVNTPPNTDKLIF; TRBV7-2*01; CDR3: CASTPFTSGSGWDEQFF). Transduced T cells (C-E) and a MART-1 reactive T cell line (DMF5) (A) were cocultured overnight with tumor cell lines previously electroporated with MART-1 or WT1 cDNA. IFNγ in coculture supernatants was measured by ELISA. * indicates >100 pg/ml IFNγ secretion by WT1 TCR transduced T cells, >2X background with any negative control target cell, and >2X background of GFP transduced T cells with the same target cell. Bars that reach 2000 pg/ml indicate off-scale IFNγ levels > 2000 pg/ml.

