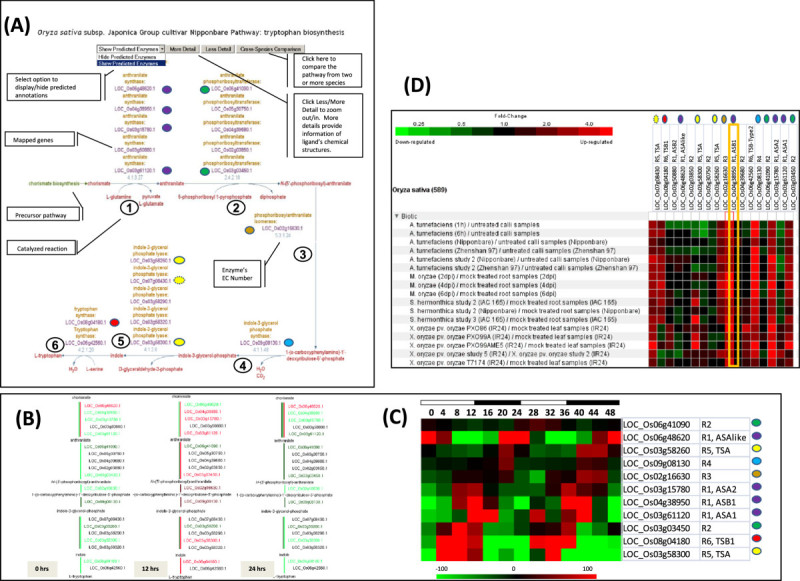
Figure 2.

Gene expression analysis of the genes associated with the enzymes catalyzing the tryptophan biosynthesis. (A) A screen shot of the tryptophan biosynthesis pathway in RiceCyc with details of different objects; precursors on pathways, input and output molecules, enzymes referred by the EC number and proteins/genes associated with the enzymatic activity of a reaction. The pathway pages provide options to display only the experimentally determined protein-enzyme activities and zoom-in (molecular structures of the compounds) and zoom-out (pathway overview) views of pathways and the option to compare similar pathways from other species. The colored dots indicate the cycling genes at each reaction as demarcated in the heatmap in C. The yellow circle with a dotted outline indicates a “cycling’ gene that marginally missed the Q value cutoff (0.79) (B) A zoom-out view of the tryptophan biosynthetic pathway with genes overlaid with the expression levels of diurnally regulated transcriptome (green/down-regulated, red/upregulated). The 0, 12 and 24 hrs profiles were chosen to record differences between the expression profiles of the rice homologs mapped to the same enzymatic activity. A majority of genes in the pathway are highly expressed (red colored) at the 12 hr time point (towards the end of the day light cycle) compared to the down regulation in dark (green colored) and at the beginning of the day light cycle. (C) A heat map display of the expression pattern of all cycling genes in the pathway with the gene ID, subunit type and reaction of the pathway. Colored circles are used to identify individual reactions. (D) Biotic and abiotic stress induction of tryptophan biosynthetic genes based on data compiled in Genevestigator for rice. Expression data available for perturbations were filtered for significance level (p- value <0.05) and fold change (>2, based on gene in column with a yellow outline).
