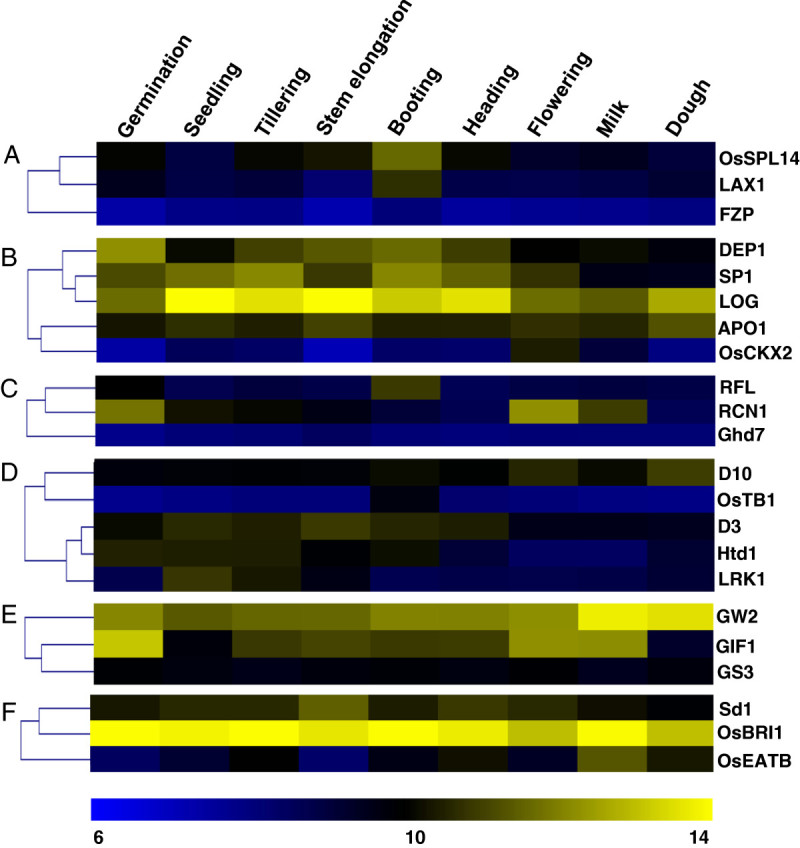
Figure 2.

Developmental expression profile of various functional classes of yield-related genes. Heat maps show microarray-based developmental expression profile based on hierarchical clustering of different classes of yield-related genes viz. genes controlling, (A) panicle development, (B) rate of spikelet formation, (C) duration of panicle differentiation, (D) Tillering, (E) grain weight, and (F) plant height. The nine physiologically distinct developmental stages in which expression of these genes was analyzed are – germination, seedling, tillering, stem elongation, booting, heading, flowering, milk, and dough; as shown at the top of the heat map. The heat maps were generated using values for log2-transformed mean signal intensities on Affymetrix 51 K array for each of the genes in respective developmental stages. Clustering in the heat maps is based on average linkage method and Pearson correlation distance metric. Color bar at the bottom represents scale for log2 expression (signal intensity).
