
Figure 3.
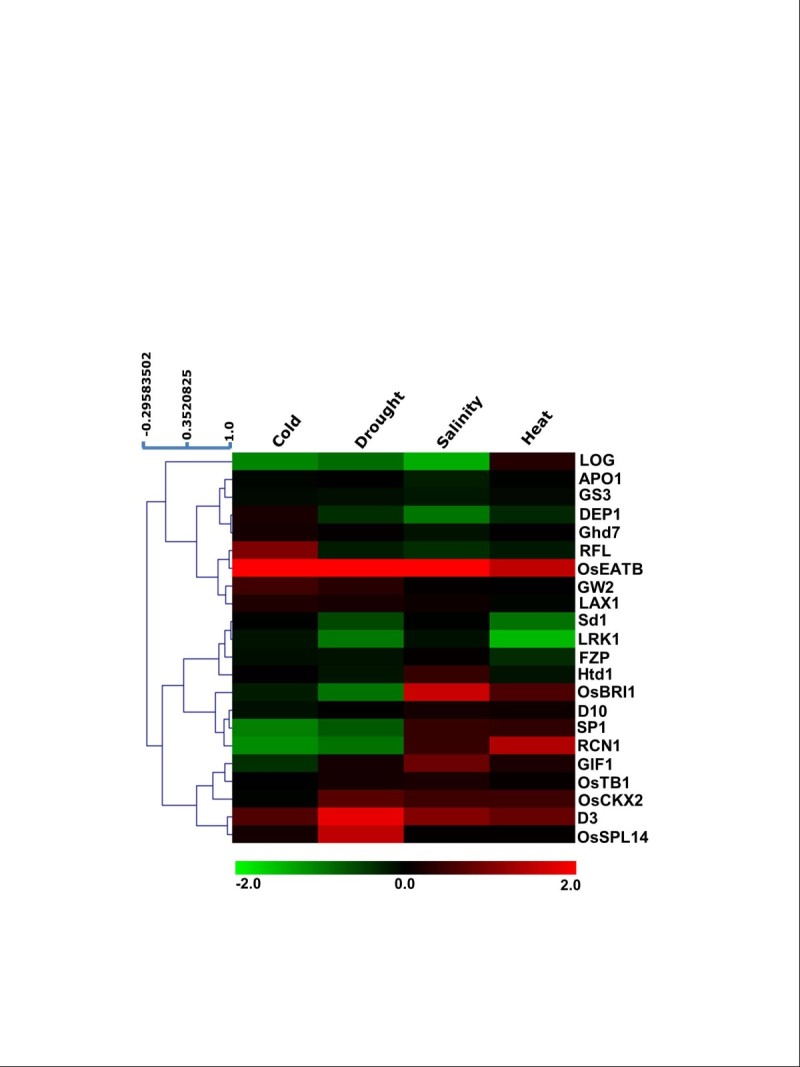
Microarray-based expression profile of yield-related genes under different abiotic stress conditions. Heat map shows expression profile based on hierarchical clustering of various yield-related genes under different stress-conditions viz. cold, drought, salt, and heat. Color bar at the bottom represents scale for log2 fold change in expression. For hierarchical clustering in the heat map, weighted average linkage method using Pearson correlation as the distance metric (scale shown at the top left of the heat map) was used. Eight of the genes viz. D3, LRK1, OsEATB, RCN1, LOG, DEP1, SP1, and OsSPL14 were found to be significantly regulated in one or more abiotic stresses.