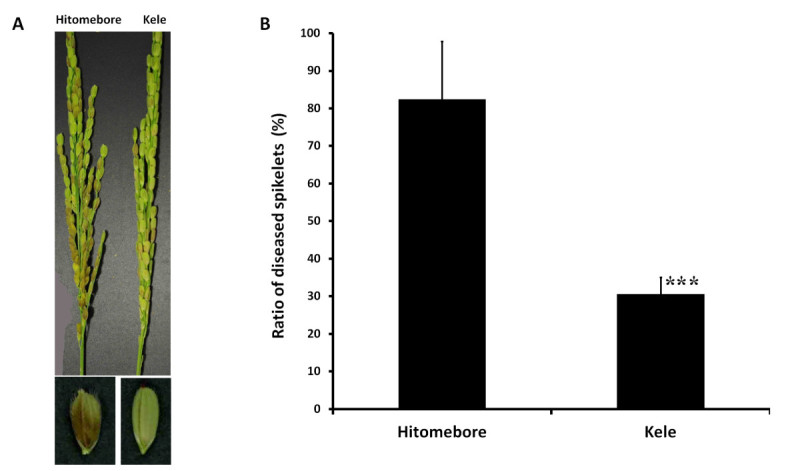
Figure 2.

BGR resistance of parental cultivars selected for QTL analysis. (A) Differences in BGR resistance between the susceptible cultivar, Hitomebore (left), and the resistant cultivar, Kele (right), measured by standard cut-panicle inoculation. (B) Comparison of BGR resistance between Hitomebore and Kele by standard cut-panicle inoculation. Error bars indicate S.D. ***P < 0.0001 (Student’s t test).
