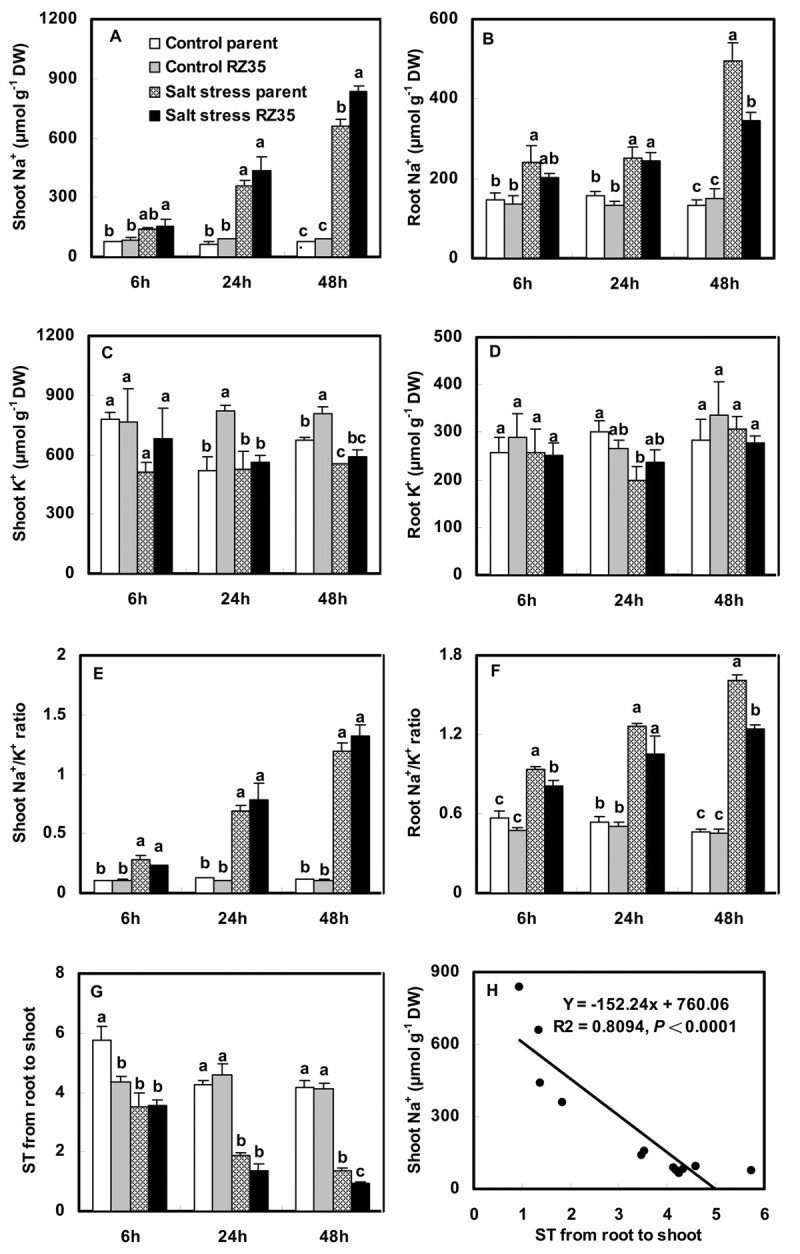
Figure 3.

Effects of salt stress on Na+, K+, Na+/K+and ST in the introgression line RZ35 and its rice parental line, Matsumae . The values shown are the means (± SE) of three biological replicates. Means followed by different letters among treatments at same time point are significantly different, according to least significant difference (LSD) test (P <0.05). 14-day-old seedlings were subjected to salt stress (100 mM NaCl) for 6 h, 24 h and 48 h. ST, selective transport capacity by different parts of plant for K+ over Na+. ST, selective transport capacity by different parts of plant for K+ over Na+. ST (root/shoot) = (Na+/K+ in root)/(Na+/K+ in shoot). The correlation analysis between ST and shoot Na+ content was performed (H).
