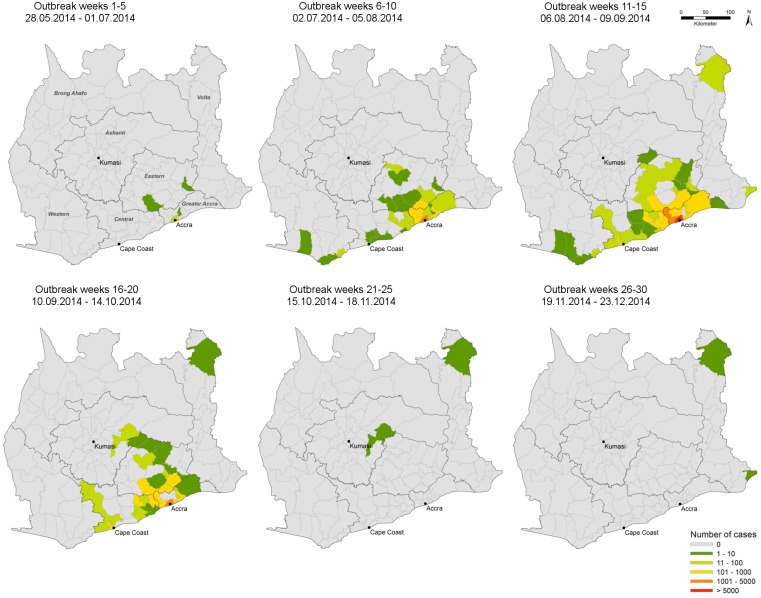
Fig 2. Spatial and temporal location of suspected cholera cases (Mai 2014-December 2014; n = 20,120).
As notified to the Disease Surveillance Service of the Ghana Health Service according to the WHO case definition suspected cholera cases are plotted by district by 5-week period panels. The figure was produced with Arc GIS 10.0 (ESRI: ArcGis Desktop: Release 10.2011).

