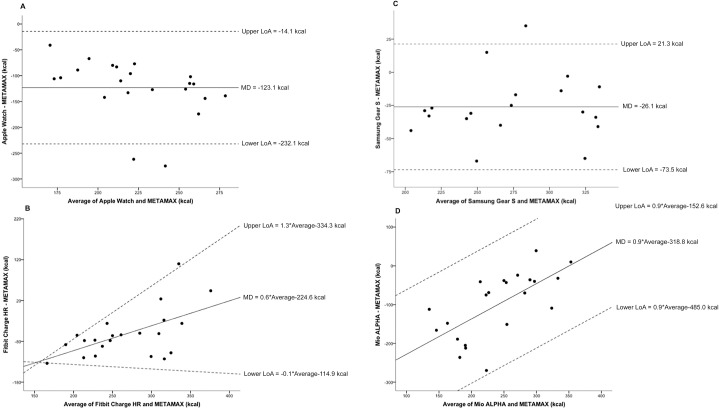
Fig 4.
Bland-Altman plots for device [(A) Apple Watch; N = 22, (B) Fitbit Charge HR; N = 22, (C) Samsung Gear S; N = 19, (D) Mio ALPHA; N = 22] and METAMAX (reference) total energy expenditure (kcal). The solid line represents the mean difference (kcal) between the two measures and the dashed lines are the 95% limits of agreement (kcal). Notes: kcal = kilocalories, LoA = limits of agreement, MD = mean difference.

