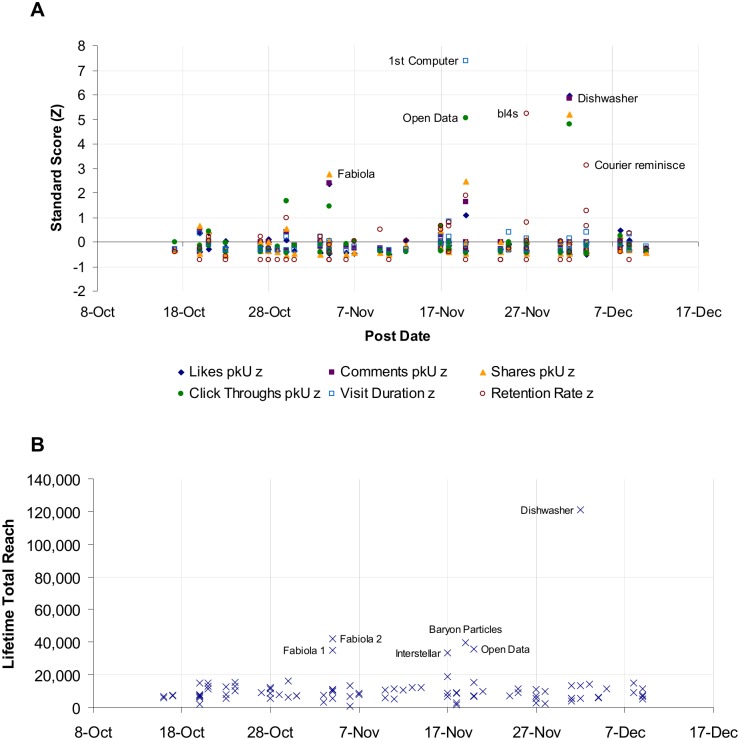
Fig 4. User engagement with scientific content and reach on CERN's Facebook page over time, October–December 2014.
(A) User engagement with scientific items over time. Zero represents the mean rate for each user behaviour on Facebook per item per 1,000 Facebook followers on the day of sampling: Likes 1.21 IPI/kU (SD 1.86); Comments 0.0779 IPI/kU (SD 0.17), Shares 0.187 IPI/kU (SD 0.32); Click-throughs 0.256 IPI/kU (SD 0.52). pkU: Per Thousand Users. Z: Z-score. The size of CERN's Facebook audience size grew from 343,000 to 367,000 over the course of the study. (B) Reach of scientific items over time. Reach is the total number of Facebook users the item was served to.

