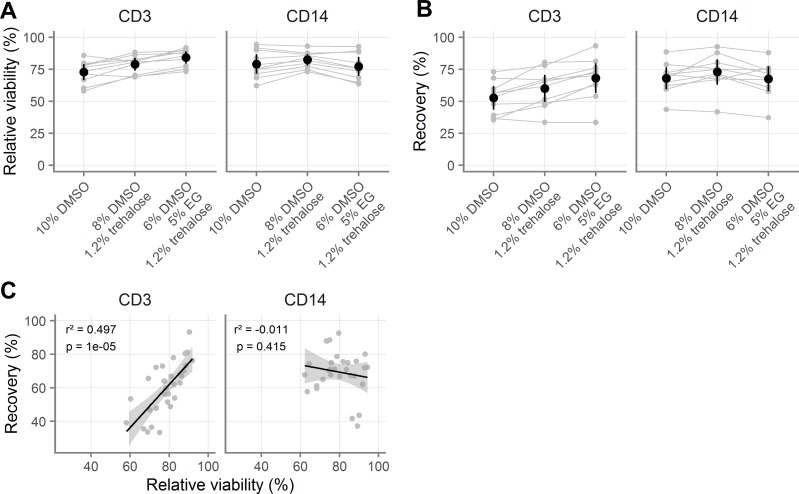
Fig 2. Validation of novel cryopreservation medium.
A-B, Comparison of three cryopreservation media by relative viability (A) and recovery (B) for vaginal T cells (indicated “CD3”) and macrophages (indicated “CD14”). All samples were processed with procedure A (see Table 1). C, Correlation of relative viability and recovery for vaginal T cells and macrophages with different cryomedia. For relative viability, 100% indicates the same viability as the fresh cells. Gray symbols indicate the average of duplicates from the same sample, with gray lines indicating pairing. Black symbols show the mean across all samples and black vertical lines show the 95% confidence interval of the mean. In C, black line indicates the slope of the linear model and the grey shaded area indicates the 95% confidence interval. Adjusted p-values and r2 values are shown from linear regression.

