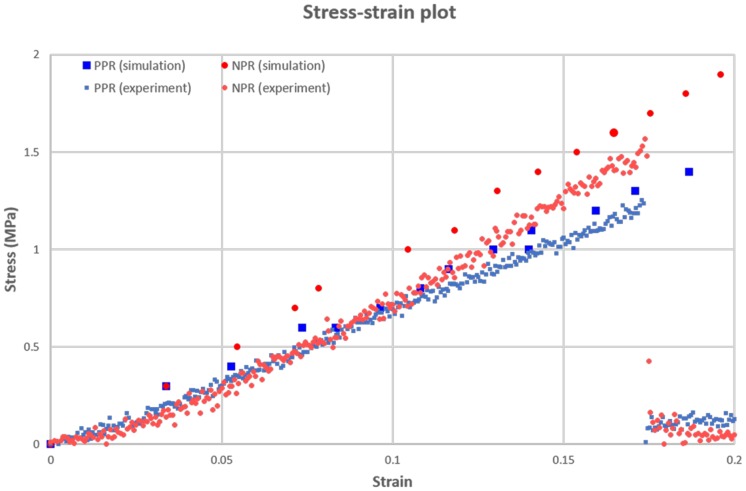
Fig 7. Stress-strain plot of the simulation and experiment at the PPR and NPR constructs.
(Large blue-color square: simulation result at PPR construct, Large red-color circle: simulation result at NPR construct, small blue-color square: experiment result at PPR construct, small red-color circle: experiment result at NPR construct.)

