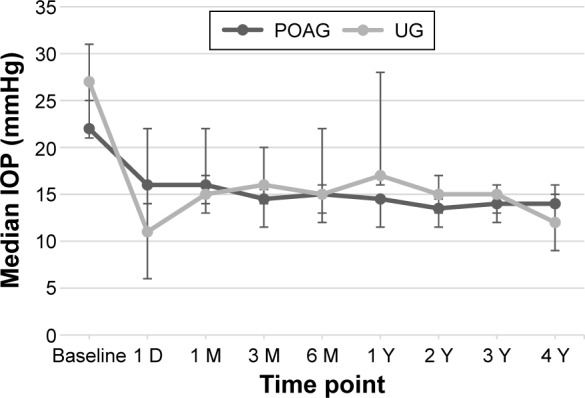
Figure 1.

Median IOP at different time points.
Notes: Decrease in median IOP was statistically significant for all time points compared to baseline value in both groups. The whiskers represent the 95% CI. The median IOP was statistically significantly different between the UG group and POAG group at baseline (P=0.03), on the first postoperative day (P<0.01), and at the 1-year follow-up (P=0.01).
Abbreviations: IOP, intraocular pressure; UG, uveitic glaucoma; POAG, primary open-angle glaucoma; D, day; M, month; Y, year.
