Figure 7.
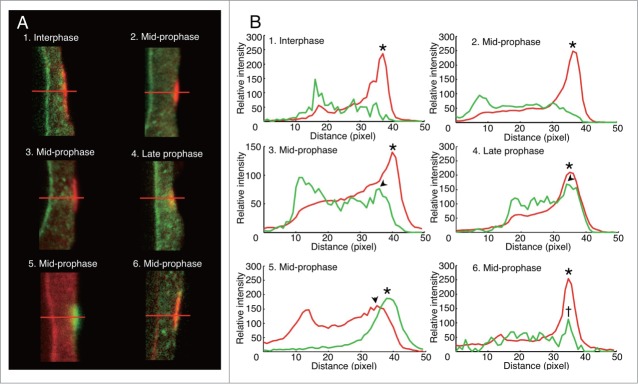
Spatio-temporal differences between RanGAP band and MT band in onion root tip cells. (A) Immunofluorescence images of PPB region of mid-longitudinal optical section of onion root tip cells 7 h after their transfer from 5- AU to distilled water. 1–4, RanGAP (green) and tubulin (red) immunofluorescence; 5, RanGAP (red) and tubulin (green) immunofluorescence; 6, MAP65 (green) and tubulin (red) immunofluorescence. (B) Fluorescence intensity profile along the red lines shown in (A). 1–6 in (B) correspond to 1–6 in (A), respectively. Fluorescence intensity profile colored red and green in (B)correspond to red and green fluorescence in A, respectively. Arrowheads, peaks of RanGAP intensities in PPBs; asterisks, peaks of tubulin intensities in PPB; dagger, the peak of MAP65 intensity. 1, PPB in interphase cell; 2,3,5,6, PPB in mid-prophase cells; 4, PPB in late prophase cell.

