
Figure 1.
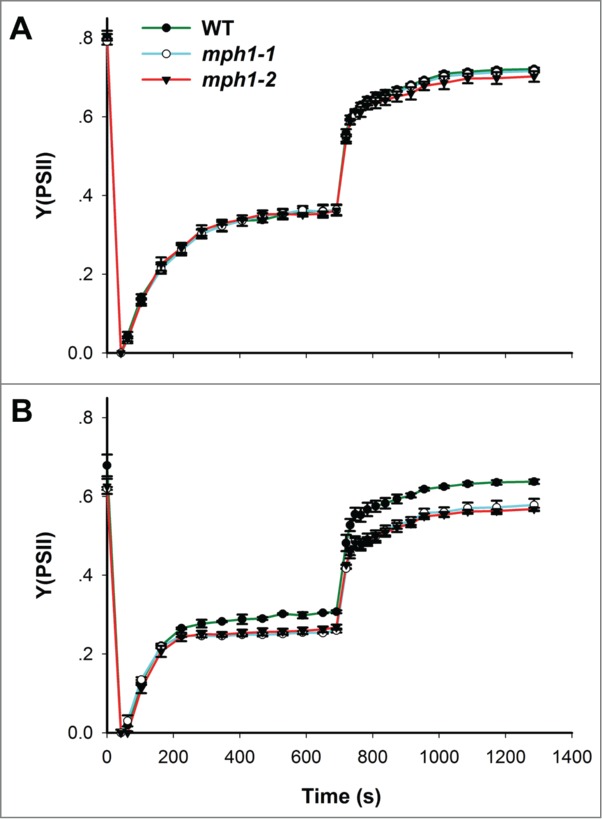
Light-response curves of ETR in mph1 mutants and wild-type plants before (A) and after (B) 3 h high-light treatment. Four-week-old plants that dark-adapted for 30 min were used for measurements of chlorophyll fluorescence parameters. Values are means±SE (n = 5).