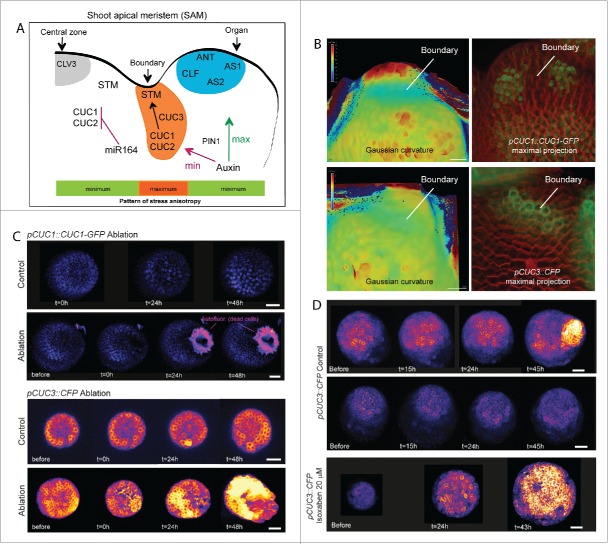
Figure 1.
Interplay between molecular and mechanical regulators at the shoot meristem boundary. (A) Shape changes at the meristem is accompanied by the expression of specific genes.52,46 Among those are ANT, CLF, AS1, AS2 that are expressed mainly in the growing organ and, CUC1, 2 and 3, the expression of which is restricted to the boundary domain.43,46,52,54 The pattern of stress anisotropy is represented by color bar with green corresponding to the regions with lower stress anisotropy (central zone and organ) and orange in the boundary domain where stress anisotropy is maximal. This stress and gene expression pattern correlates with the distribution of the plant hormone auxin that has its local maximum where new organ initiates and its local minimum at the organ boundary.8,17,38 Acting in a PIN1-dependent manner, auxin may promote organ emergence, notably through the repression of KNOX genes,11,16,41 whereas in the boundary, it may negatively regulate the axillary meristem formation.50 (B) CUC1 and CUC3 expression pattern at the boundary in meristems from greenhouse-grown plants: Signal intensity (right panels) and Gaussian curvature (left panels) of pCUC1::CUC1-GFP and pCUC3::CFP in representative SAM. Membranes were labeled with FM4–64. Gaussian curvature is extracted using the level set method and MorphoGraphX. Representative images highlighting the differences between pCUC1::CUC1-GFP and pCUC3::CFP signal intensities in young boundaries, as revealed by the curvature map. Scale bars: 10 μm. (C) Expression of pCUC1::CUC1-GFP (upper panels) and pCUC3::CFP (lower panels) in meristems from in vitro grown plants, before and after ablation. Expression is shown using the Fire lookup table in ImageJ, with the threshold of 5 in the Fire representation. No significant induction of signal is observed for pCUC1::CUC1-GFP; only an increase of autofluorescence in dead cells can be detected 24 hour after ablation. In contrast, pCUC3::CFP expression (lower panels) is induced 24 hours after ablation, when compared to control. Scale bar, 20 μm. (D) Expression of pCUC3::CFP in meristems from in vitro grown plants, before and after treatment with 20 µM isoxaben. The two upper panels display representative untreated pCUC3::CFP meristems with induction only when an organ emerges (upper panel). In contrast, after the isoxaben treatment the intensity of pCUC3::CFP signal is induced everywhere in the meristem, when compared to control. Scale bar, 20 μm.

