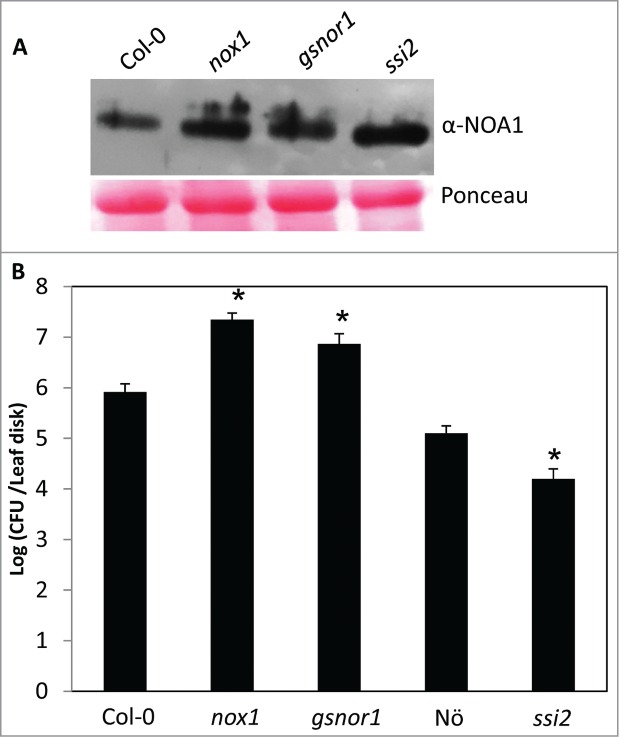
Figure 2.

NOA1 levels and pathogen resistance in ssi2, gsnor and nox1 plants. (A) Protein immunoblot showing NOA1 levels in indicated genotypes. Ponceau-S staining of the immunoblot was used as the loading control. (B) Growth of virulent Pseudomonas syringae DC3000 bacteria on indicated genotypes. The error bars indicate SD (n = 4). Asterisks indicate data statistically significant from wild-type (Columbia, Col-0; Nössen, Nö P<0.003). The experiment was repeated twice with similar results.
