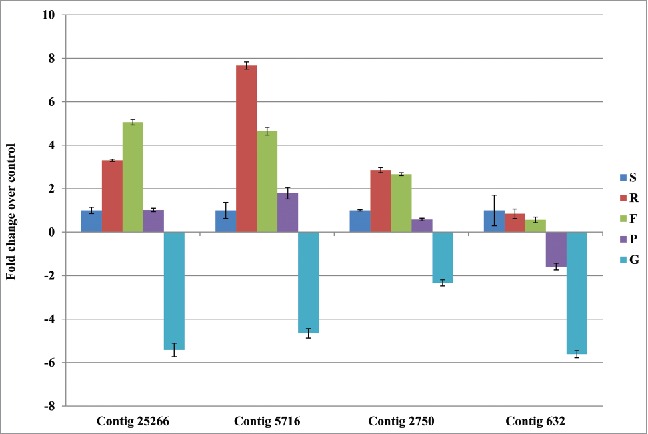
Figure 8.

qPCR analysis of TM-START proteins of chickpea genes done in different tissues. Relative fold change values are given with respect to GADPH2 was used as reference genes. S-Shoot: R-Root: F-Flower : P-Young pod: G-Grain. The expression in shoot was taken as 1 and compared to other tissues.
