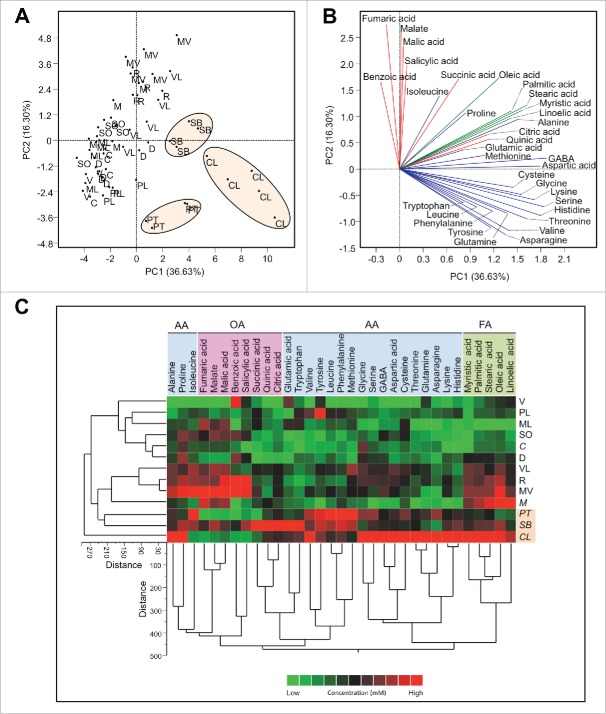
Figure 1.
Principal components analysis-scatter plot (A), its associated loading plot (B) and two-way hierarchical cluster analysis and heat-map (C) showing the distribution of different citrus varieties using the concentration of detected compounds in phloem saps (n ranges from 4 to 5). Row represents variety and column compound concentrations. Cells are colored based on concentration in mM. AA: amino acids, OA: organic acids, FA: fatty acids. Varieties abbreviations: Valencia sweet orange (V), Madam Vinous sweet orange (MV), Duncan grapefruit (D), Ruby red grapefruit (R), Sour orange (SO), Volkamer lemon (VL), Alemow (M), Palestine sweet lime (PL), Mexican lime (ML), Carrizo citrange (C), Severinia buxifolia (SB), Poncirus trifoliata (PT), and Citrus latipes (CL).

