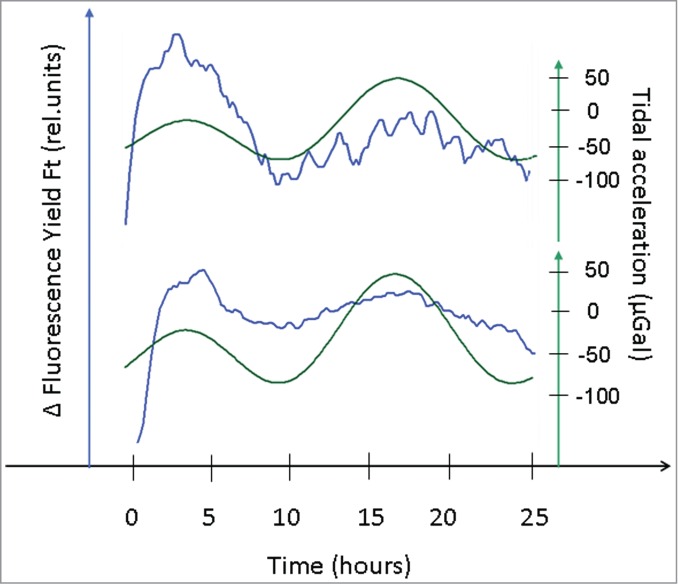
Figure 2.

Linearized chlorophyll fluorescence yield (ΔFt, blue traces) recordings derived from 2 separate (representative) leaves of distinct plants measured in parallel over a period of 25 h (LL). These traces of ΔFt were aligned with the lunisolar tidal acceleration profile (green lines).
