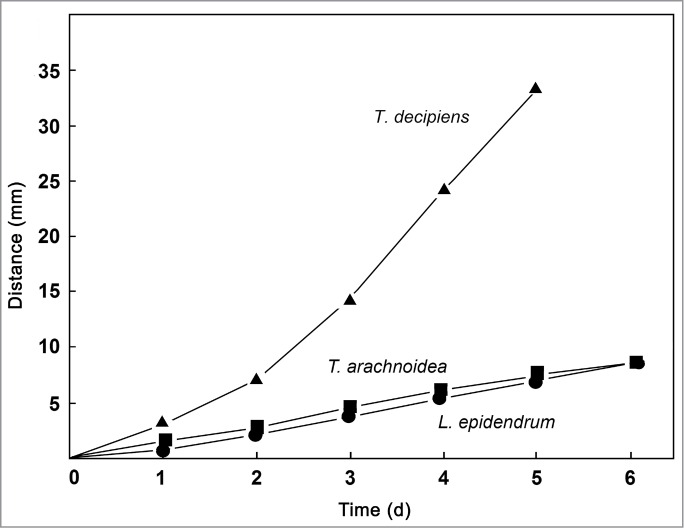
Figure 5.

Comparative analysis of cell motility in populations of 3 species of myxamoebae in the presence of bacterial prey organisms (A. tumefaciens). The distance from the center of the agar plate was measured at daily intervals as shown in Figure 1A. Data points represent means (± s.e.m.) of 51 measurements each (standard errors of the means are smaller than the size of the symbols).
