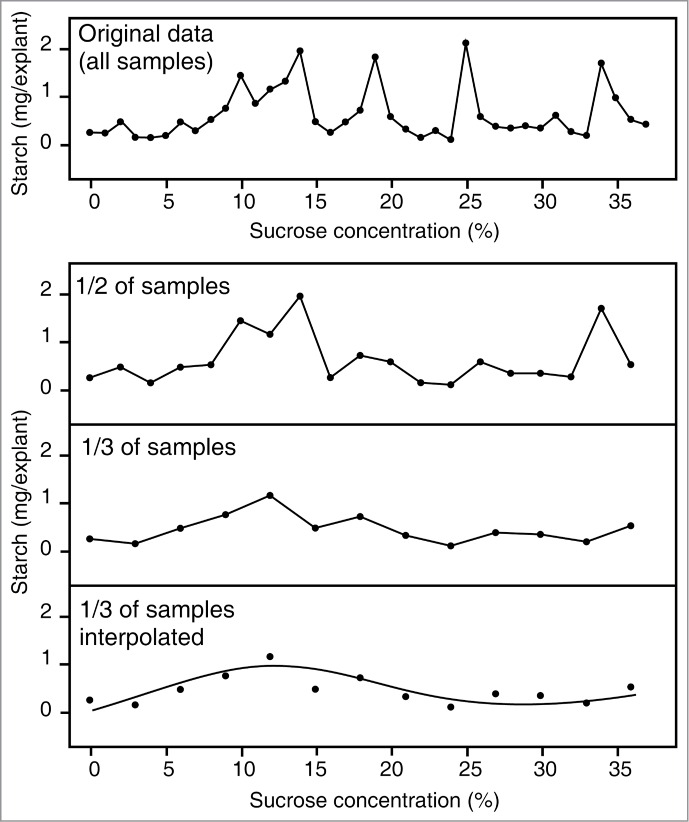
Figure 2.

Top: a complex, non-monotonic dose response curve showing the dependence of starch content in kale stem pith explants on sucrose concentration in culture media (from ref. 8). Bottom: reduced sampling frequency substantially alters the apparent dose-response curve. A simple curve with a single maximum and single inflection point can be interpolated between sparsely sampled data points. Note that similar effects of varying sampling frequency would occur also for a complex monotonic dose-response curve, which may appear simple if sampled sparsely.
