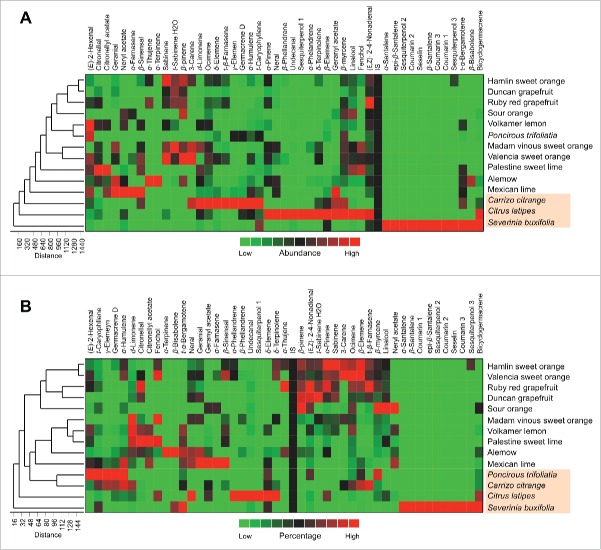
Figure 3.
Hierarchical cluster analysis (HCA) and heat-map using the abundances (A) and percentages (B) of all volatiles of different citrus varieties in the hexane extract (n = 5). Row represents variety and column compound abundance (A ) or percentage in (B). Cells are colored in based on abundances (A) or percentages (B). Red represents high abundances (A) or high percentages (B).

