
Figure 1.
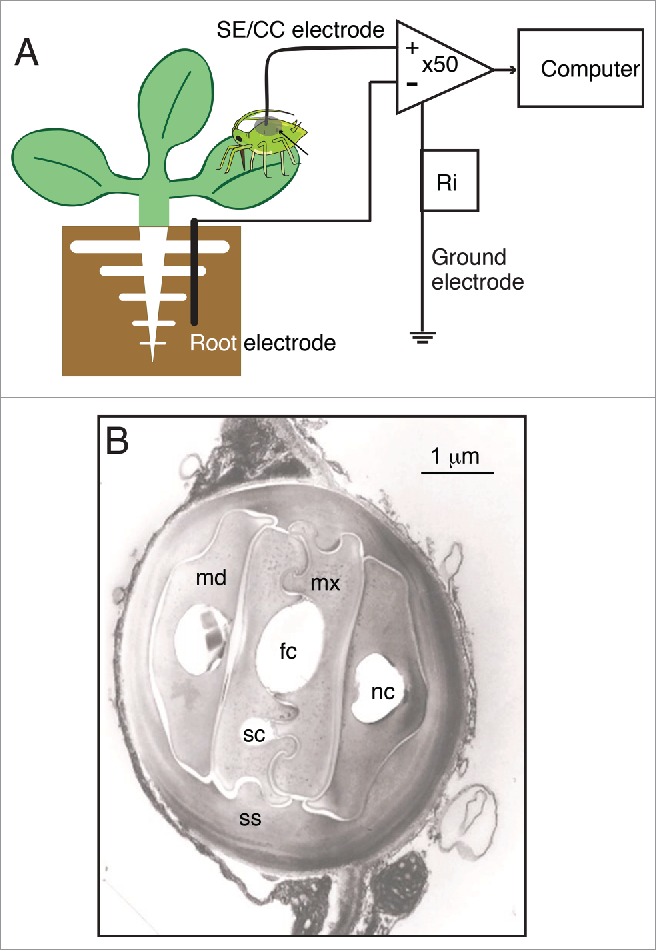
The Electrical Penetration Graph (EPG) re-purposed for whole-plant electrophysiology. (A) Diagram of the general configuration of the EPG rig, which records potential differences between a coarse copper electrode placed within the root medium, and a SE/CC electrode, represented by the stylet bundle of an aphid or other phloem-feeding insect. The insect is integrated into the EPG via an ultra-thin (ø = 18 µm) gold wire immersed into a dried up droplet of silver glue on the aphid's abdomen. Both electrodes feed into a differential amplifier with an inverting input and a non-inverting input. The input resistance (Ri = 1 GΩ) lies between the ground electrode and the point of measurement. (B) Electron micrograph of a transversal section of the stylet bundle of Nasonovia ribisnigri in between cells of Lactuca sativa. Abbreviations used are: fc = food canal, sc = salivary canal, mx = maxillar stylet, md = mandibular stylet, nc = neural canal, ss = salivary sheath. Image courtesy of Freddy Tjallingii.