
Figure 3.
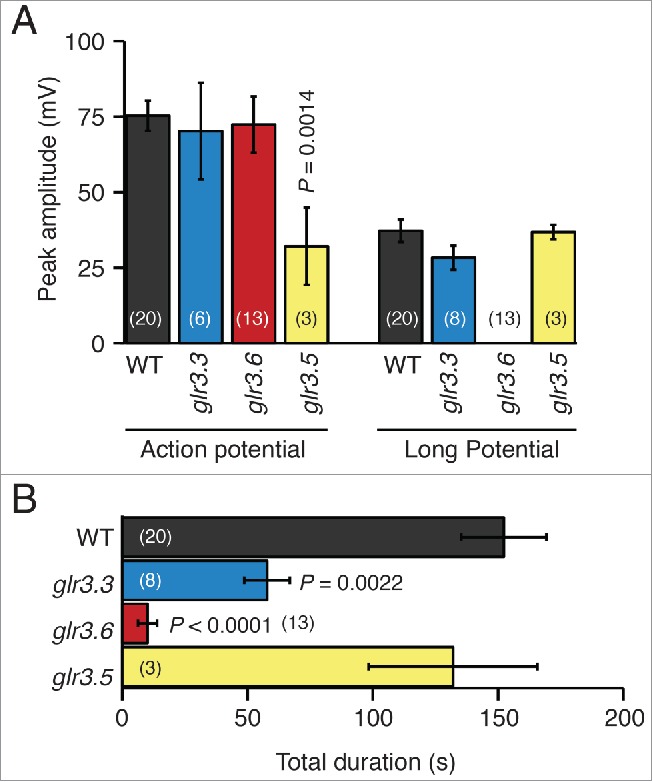
Amplitudes and durations of wound-induced systemic potentials between the root and SE/CCs in neighbor leaves of Arabidopsis thaliana wild type and single GLR mutants. (A) Average maximal (peak) amplitudes of action potentials and long potentials produced by wild type (WT), glr3.3, glr3.6, and glr3.5 plants, recorded by EPG in the configuration shown in the inset of Fig. 2. (B) Average durations of the total systemic potentials in wild type (WT), and in each of the mutant plants. Bars represent mean ± s.e.m. The number of plants is indicated in parentheses. Statistical differences between the mean amplitudes and durations of the potentials in wild type and each of the mutants were assessed with Student's t tests.