
Figure 5.
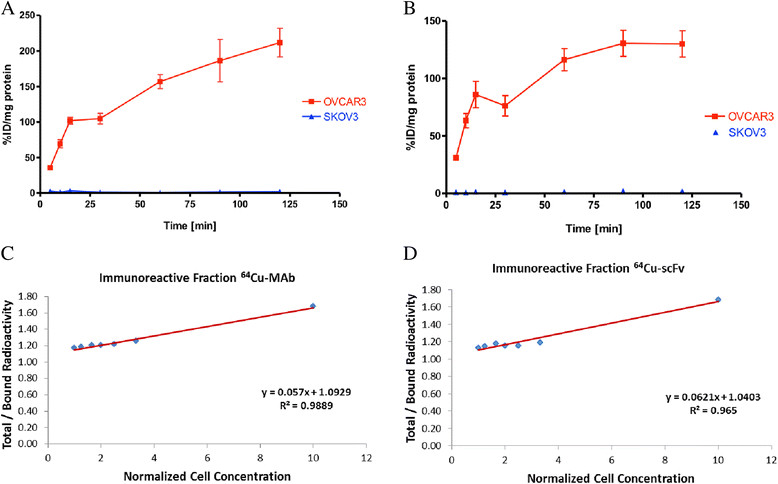
Cell uptake and double inverse plots. Graphs for cell uptake of (A)64Cu-labeled anti-CA125 MAb and (B)64Cu-labeled anti-CA125 scFv in NIH:OVCAR-3 and SKOV3 cells. Representative double inverse plots from Lindmo assays performed with (C)64Cu-labeled anti-CA125 MAb and (D)64Cu-labeled anti-CA125 scFv in NIH:OVCAR-3 cells.