
Figure 2.
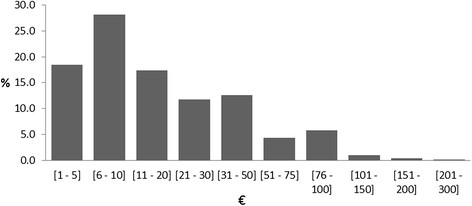
Categories of the parental willingness to pay (WTP). Bar chart showing the 10 categories of WTP and the respective percentages referring to n = 710 participants.
Official websites use .gov
A
.gov website belongs to an official
government organization in the United States.
Secure .gov websites use HTTPS
A lock (
) or https:// means you've safely
connected to the .gov website. Share sensitive
information only on official, secure websites.
Categories of the parental willingness to pay (WTP). Bar chart showing the 10 categories of WTP and the respective percentages referring to n = 710 participants.