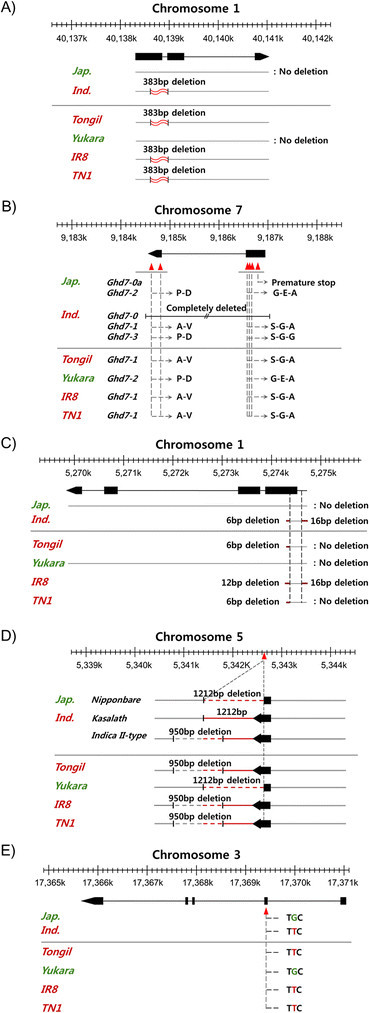
Figure 3.

Indica / japonica region comparisons of high yield-related alleles or QTLs. A) sd1, B) Ghd7, C) Gn1a, D) qSW5, and E) GS3. Black arrows and box regions represent exons. Vertical, dashed lines refer to the same position in the genome or gene region.
