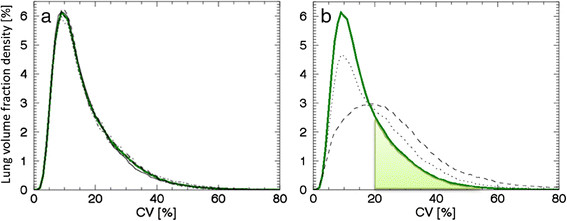
Figure 1.

Density curves for low AUC(CV > 20%) subjects and patients (P1 and P2). (a) Density curves corresponding to subject S1 (solid line), S2 (dotted line), S3 (dashed line) and S4 (dashed-dotted line), together with their constructed mean curve in green. (b) Density curves of patient P1 (dotted line) and P2 (dashed line) together with the mean curve (green line). AUC for CV values greater than 20%, i.e. AUC(CV > 20%), for the mean curve is marked as light green.
