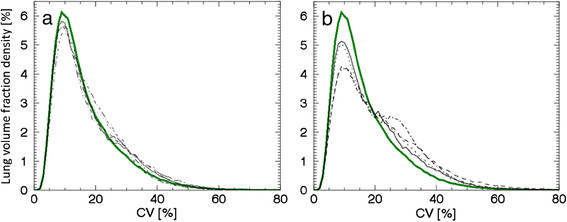
Figure 2.

Density curves for intermediate-AUC(CV > 20%) subjects (S5-S9) and high-AUC(CV > 20%) subjects (S10 to S13). (a) Five density curves corresponding to intermediate AUC(CV > 20%) values; subject S5 (solid line), S6 (dotted line), S7 (dashed line), S8 (dashed-dotted line) and S9 (dashed-dotted-dotted line), together with the mean curve (green line). (b) Four density curves corresponding to the highest AUC(CV > 20%) values of subjects; subject S10 (solid line), S11 (dotted line), S12 (dashed-dotted line) and S13 (dashed line), together with the mean curve (green line).
