Figure 3.

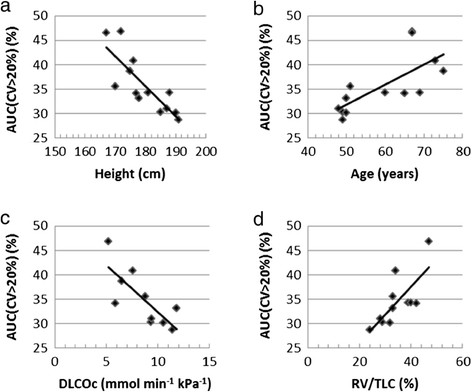
Correlation between AUC(CV > 20%) and (a) height, (b) age, (c) DLCOc and (d) RV/TLC. For subjects (S1 to S13). Spread of data to the regression line is shown for each parameter in (a-d).

Correlation between AUC(CV > 20%) and (a) height, (b) age, (c) DLCOc and (d) RV/TLC. For subjects (S1 to S13). Spread of data to the regression line is shown for each parameter in (a-d).