Figure 4.

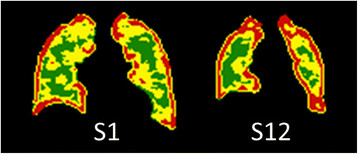
Coronal slices of CV matrices for subjects S1 and S12. CV slices with CV values below 9.5% in green, between 9.5% and 20% in yellow and above 20% in red for subject S1 to the left and subject S12 to the right.

Coronal slices of CV matrices for subjects S1 and S12. CV slices with CV values below 9.5% in green, between 9.5% and 20% in yellow and above 20% in red for subject S1 to the left and subject S12 to the right.