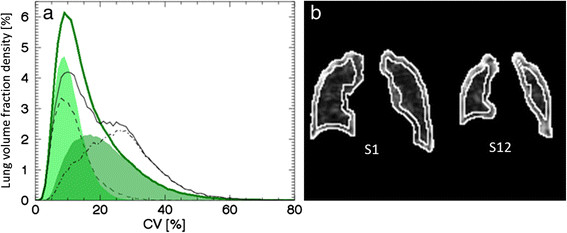
Figure 5.

Entire, inner, peripheral density curves for mean (S1 to S4) and S12, and coronal inner/peripheral contours. The segmented lung divided into inner and outer volumes, (a) the mean density curve (solid green line), and its inner (light green area), and outer (dark green area) volume components, as well as the S12 density curve (solid black line), and its inner (black dashed line) and outer (black dash-dotted line) volume components. (b) Coronal slices of the CV matrix for S1 (left, used to calculate the mean) and S12 (right). Contours indicate the inner and outer volumes.
