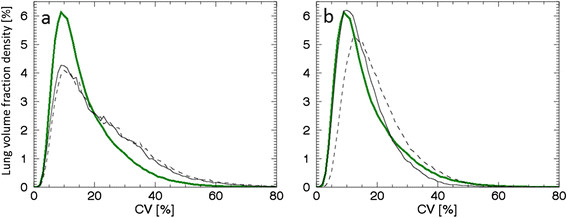
Figure 8.

Density curves before and after compensation for (a) S13 and (b) S (excluded); both with mean (S1 to S4). For both subjects, curves are shown for before (black dashed line), after (black solid line) compensation, together with the compensated mean curve (green solid line). The subject in (b) was excluded due to a relatively low concentration of Tc particles per unit volume in the lung.
