
Figure 4.
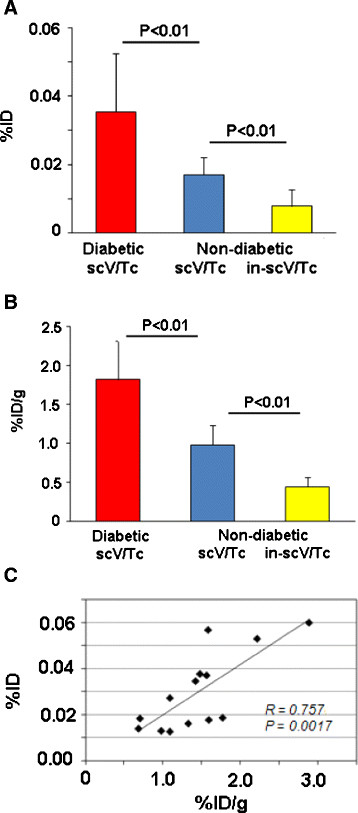
Quantitative analysis of tracer uptake. (A) Average %ID ± standard deviation for uptake of functionally active scV/Tc in diabetic (red bar), non-diabetic (blue bar), and nonspecific (non-VEGFR-mediated) in-scV/Tc uptake in non-diabetic ApoE−/− mice (yellow bar). (B) Average %ID/g for the same groups of mice, as calculated from gamma well counting of harvested aorta. (C) Correlation for %ID vs. %ID/g.