Figure 1.

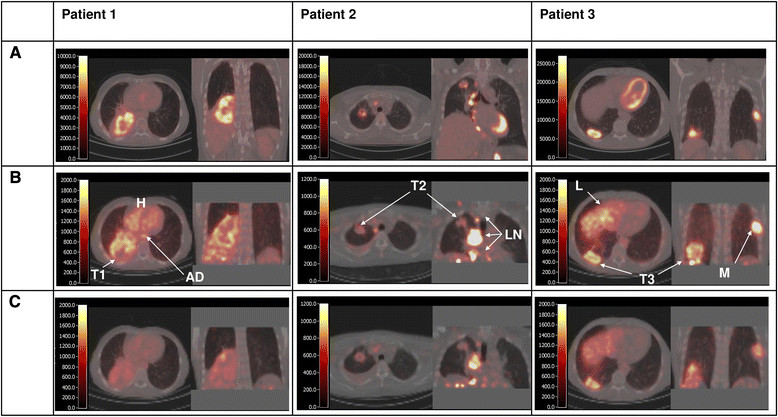
Fused PET/CT images using FDG (A) and89Zr-bevacizumab at day 4 (B) and day 7 (C). Per scan, an axial and coronal slice is shown. The color scale, indicating Becquerels per milliliter (BQML), ranges from 0 to a maximum value that corresponds with a SUV value of 6. In patient 1, a large tumor in the right lower lobe is seen. There is increased FDG uptake in the outer rims of the tumor and reduced uptake in the center of the tumor (probably due to necrosis). The 89Zr-bevacizumab image on day 4 also shows high uptake in the outer rims of the tumor (T1) and high blood activity concentration (aorta descendens (AD) and heart chambers (H)). Low uptake is found in non-tumor tissues, such as healthy lung, fat, and muscle. The 89Zr-bevacizumab image on day 7 shows high uptake in the outer rims of the tumor but low uptake in healthy tissues as well as low blood activity concentrations. In patient 2, the FDG scan shows increased uptake in both the primary tumor in the right upper lobe and enlarged mediastinal lymph node metastases. Interestingly, the 89Zr-bevacizumab images only show increased uptake in the lymph node metastases (LN), while the uptake in the primary tumor (T2) on both days 4 and 7 is faint. In patient 3, the primary tumor, the mediastinal lymph node metastases, and rib metastasis all show increased FDG uptake. The 89Zr-bevacizumab scans on days 4 and 7 show the highest uptake in the rib metastasis (M) and the primary tumor (T3), and moderate to high uptake is seen in the liver (L).
