
Figure A1.
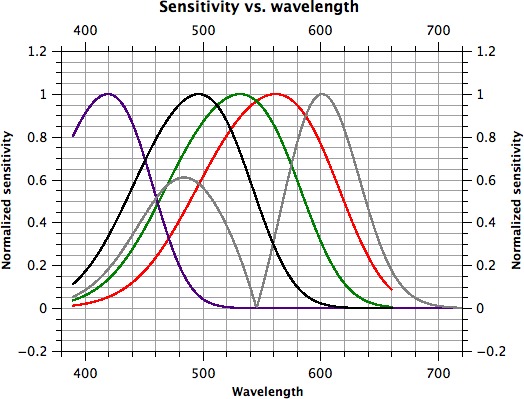
Spectral sensitivity of generated photoreceptor/post-receptoral mechanism templates. S-cones are represented by a violet line, M-cones by a dark green line, L-cones by a red line, rods by a black line and the M- versus L-mechanism by a gray line.