
Figure 1.
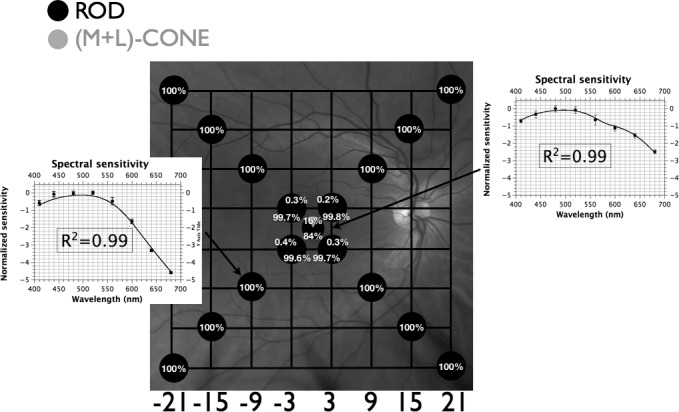
Fundus projection of differential sensitivities of rod and cone mechanisms under scotopic conditions. Gridlines are separated by 6°; each circle represents the fundus-projected location in the visual field; relative quantal catches for an equiquantal stimulus incident on the photoreceptor layer are depicted by pie charts at each location (black corresponds to absorption by rods; gray to absorption by M+L-cones); insets demonstrate spectral sensitivity (mean of 3 observers ± SEM) with best-fitting template combinations (see text) and their adjusted R2 values. Targets at peripheral locations are detected by rods while targets at fixation, and to a lesser extent at [±3°, ±3°], are detected by a combination of rods and (M+L)-cones.